Orbitalis
A NASA Space Apps 2026 entry (team Halmahera) that turns NISAR radar data into ranked groundwater-pumping inspection leads for Jakarta regulators.
 Ariq Heritsa MaalikOct 2026 – Nov 2026
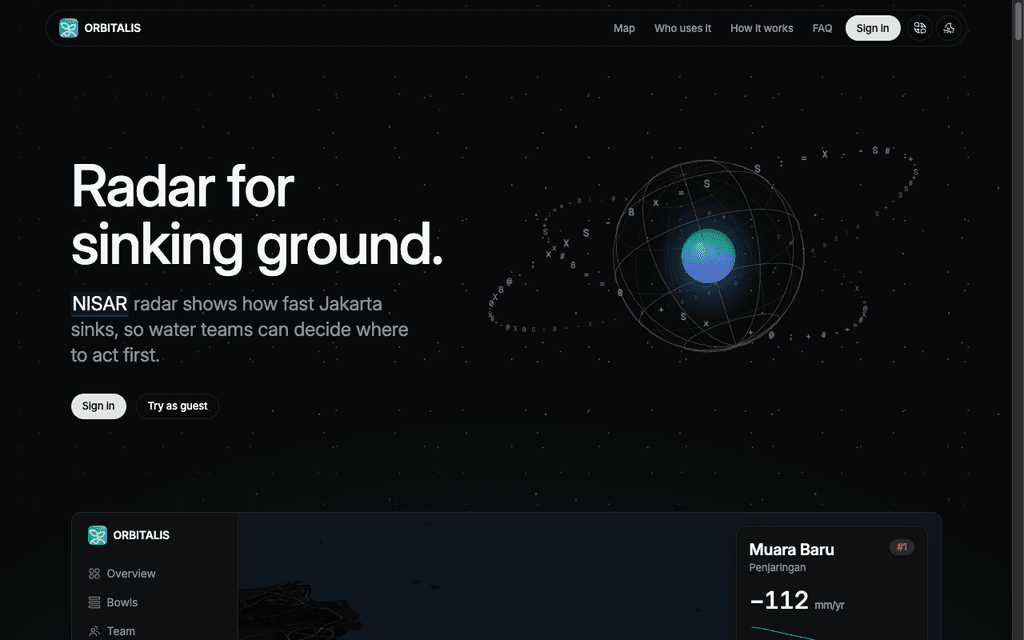
Orbitalis turns NISAR radar into inspection leads for the people who manage groundwater in Jakarta. It finds ground that sinks faster than its surroundings, ranks it by severity and by the people nearby, and tracks each field visit through to recovery.
We built it as team Halmahera for the NASA Space Apps Challenge 2026. On real NISAR data, it found three subsidence bowls in Jakarta. The strongest sinks 82 mm/yr faster than the ground around it.
With Orbitalis, a regulator can:
- Rank leads by severity and by the number of people nearby
- Inspect the ground beneath each lead in a 3D digital twin
- Schedule visits, assign inspectors, and record outcomes
- Verify recovery with the same radar record after every 12-day pass
Here is how it works.
Pumping leaves a bowl in the ground
Parts of Jakarta sink more than 10 cm a year, mostly because deep wells pump out groundwater. Jakarta banned groundwater use in large zones in 2023, but regulators cannot see where pumping continues.
A pump leaves a bowl in the ground around it, and radar can measure a bowl from orbit. Orbitalis reads NISAR L-band interferograms (GUNW) over all of mainland Jakarta from two directions and stacks sixteen pairs from June to October 2026. It then looks for ground that sinks faster than the ground around it.
A ranked queue of leads
The map shows the measured sinking rate for every 480 m cell, next to WorldPop population. Leads rank by signal strength, sinking rate, and the number of people nearby.
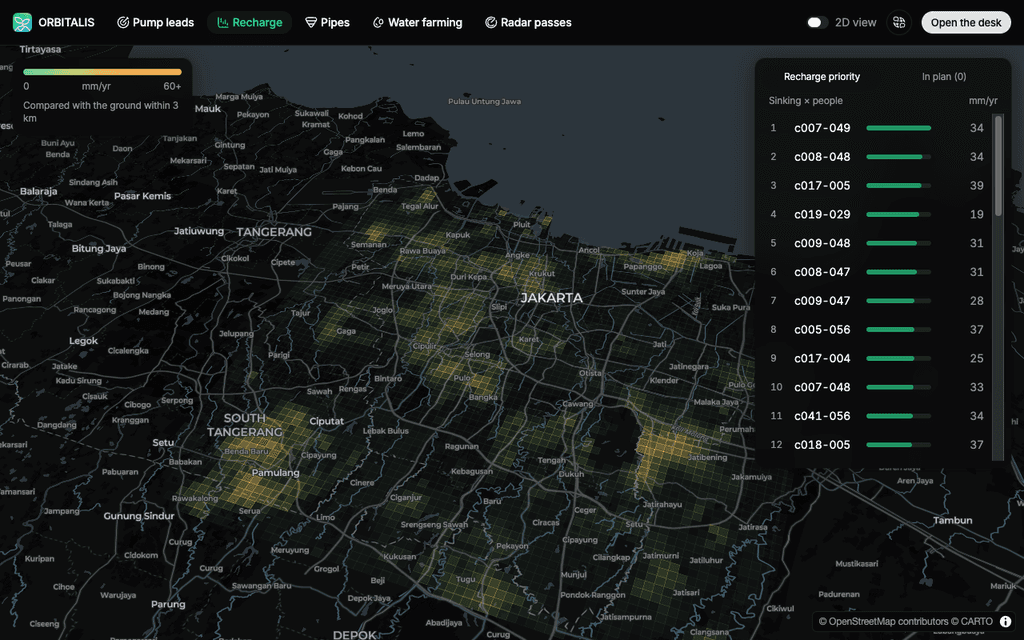
Switch between four layers (leads, sinking, people, and radar passes), open any cell, and flag it as a new lead.
A digital twin for every lead
Each lead opens a model of the ground beneath it, with soil layers, buildings, and a timeline to 2050. The timeline is the measured rate times the years, not a forecast.
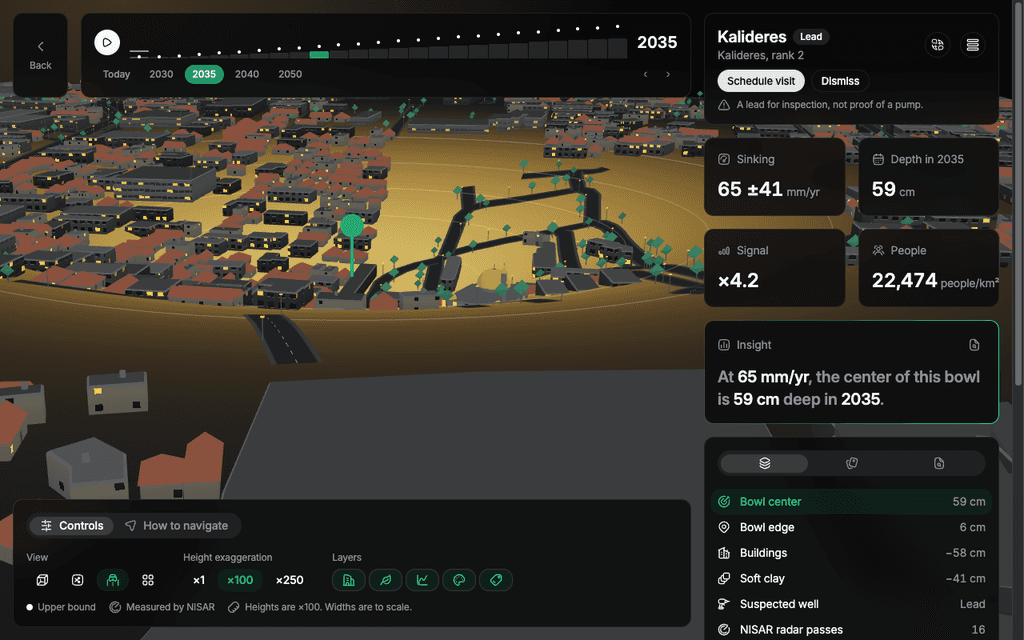
From the twin, a regulator schedules a visit, assigns an inspector, and records what they find. After action is taken, the same radar record shows whether sinking slows or the ground rebounds.
From radar to leads
Orbitalis uses InSAR. A radar satellite measures the phase of the signal reflected from the ground, which depends on the distance between satellite and ground. Compare two images of the same area and any ground movement shows up as a phase difference, a map called an interferogram. NISAR collects this in L-band, with a 23.8 cm wavelength, which estimates subsidence better in vegetated areas than shorter wavelengths.
A Python job turns the interferograms into the numbers the app shows:
- Find the data. The job searches ASF for NISAR L2 GUNW products over Jakarta: track 10 ascending and track 18 descending (frame 92), with 8 consecutive pairs each.
- Read only what is needed. It reads the mainland Jakarta window (about 33 by 33 km, 80 m grid) with HTTP range requests. One pair takes about 1.7 MB instead of 2.3 GB.
- Clean each pair. It masks water and pixels with coherence below 0.6, removes the ionosphere phase screen, and converts phase to millimeters of range change.
- Stack per track. It removes the regional ramp, stacks the pairs, and divides by the time.
- Combine two directions. The two tracks look from the east and from the west, so the job solves for vertical and east motion. A negative vertical rate means the ground is sinking. A positive rate means it is rising, which can indicate groundwater uplift or recovery.
- Find bowls. A bowl is a local depression where the ground compacts over a heavily pumped aquifer. The job looks for a local peak at least 2.5 times the noise floor and 1.5 times its own uncertainty.
- Add people. It averages the rate into 480 m cells and adds WorldPop 2026 population.
The web app, Next.js on Cloudflare Workers, reads the job output as small JSON files. Scores are fixed formulas with visible weights. There is no machine learning model.
Three bowls pass every test
The first run on real NISAR data gave:
- 62% of pixels with at least five usable pairs on both tracks
- A vertical noise floor of 15 mm/yr
- Positive extra sinking in Muara Baru, Pluit, and Penjaringan, the areas that published studies name as the fastest sinking
Three bowls pass every test, and both tracks see all three. The strongest is in Penjaringan, about 190 m in radius, at 5.3 times the noise floor.
| Bowl | Extra sinking |
|---|---|
| Penjaringan | 82 ± 39 mm/yr |
| Kalideres | 65 ± 41 mm/yr |
| Rawakalong | 55 ± 35 mm/yr |
A bowl is a reason for a field visit, not proof of a pump.
Known limits
- The NISAR rate is relative to the ground within about 3 km, not an absolute rate.
- It is a simple stack, not a full time series.
- Each bowl rate is only 1.5 to 2 times its uncertainty, because there are only 3.5 months of data.
- The projection to 2050 is the measured rate times the years, not a forecast.
Built with
- Web: TypeScript, Next.js 16, React 19, MapLibre GL, three.js with React Three Fiber, Tailwind CSS 4, shadcn/ui, Better Auth, Drizzle ORM, PostgreSQL (Neon), Cloudflare Workers, Bun, and Turborepo
- Data jobs: Python 3.11, h5py, NumPy, SciPy, pyproj, and Pillow
- Data: NISAR L2 GUNW unwrapped interferograms from the ASF DAAC, the WorldPop 2026 population grid, and OpenStreetMap data through CARTO for the basemap
We used Claude Code to write and review parts of the code, and the team reviewed and tested the output. No AI model runs inside the product.
Team Halmahera
Five people from the Jakarta local event build Orbitalis together.
- Nadya Khairani, product and business
- Ariq Heritsa Maalik, product design engineering
- Muhammad Zaki Rabbani, research
- Akmal Muzakki Bakir, AI and software engineering
- Muhammad Sya’bani Falif, data engineering
What's next
NISAR repeats every 12 days, so the same pipeline can check after every pass whether enforcement, pipes, and recharge slow the sinking. Next, we plan to replace the simple stack with a full time series using MintPy.